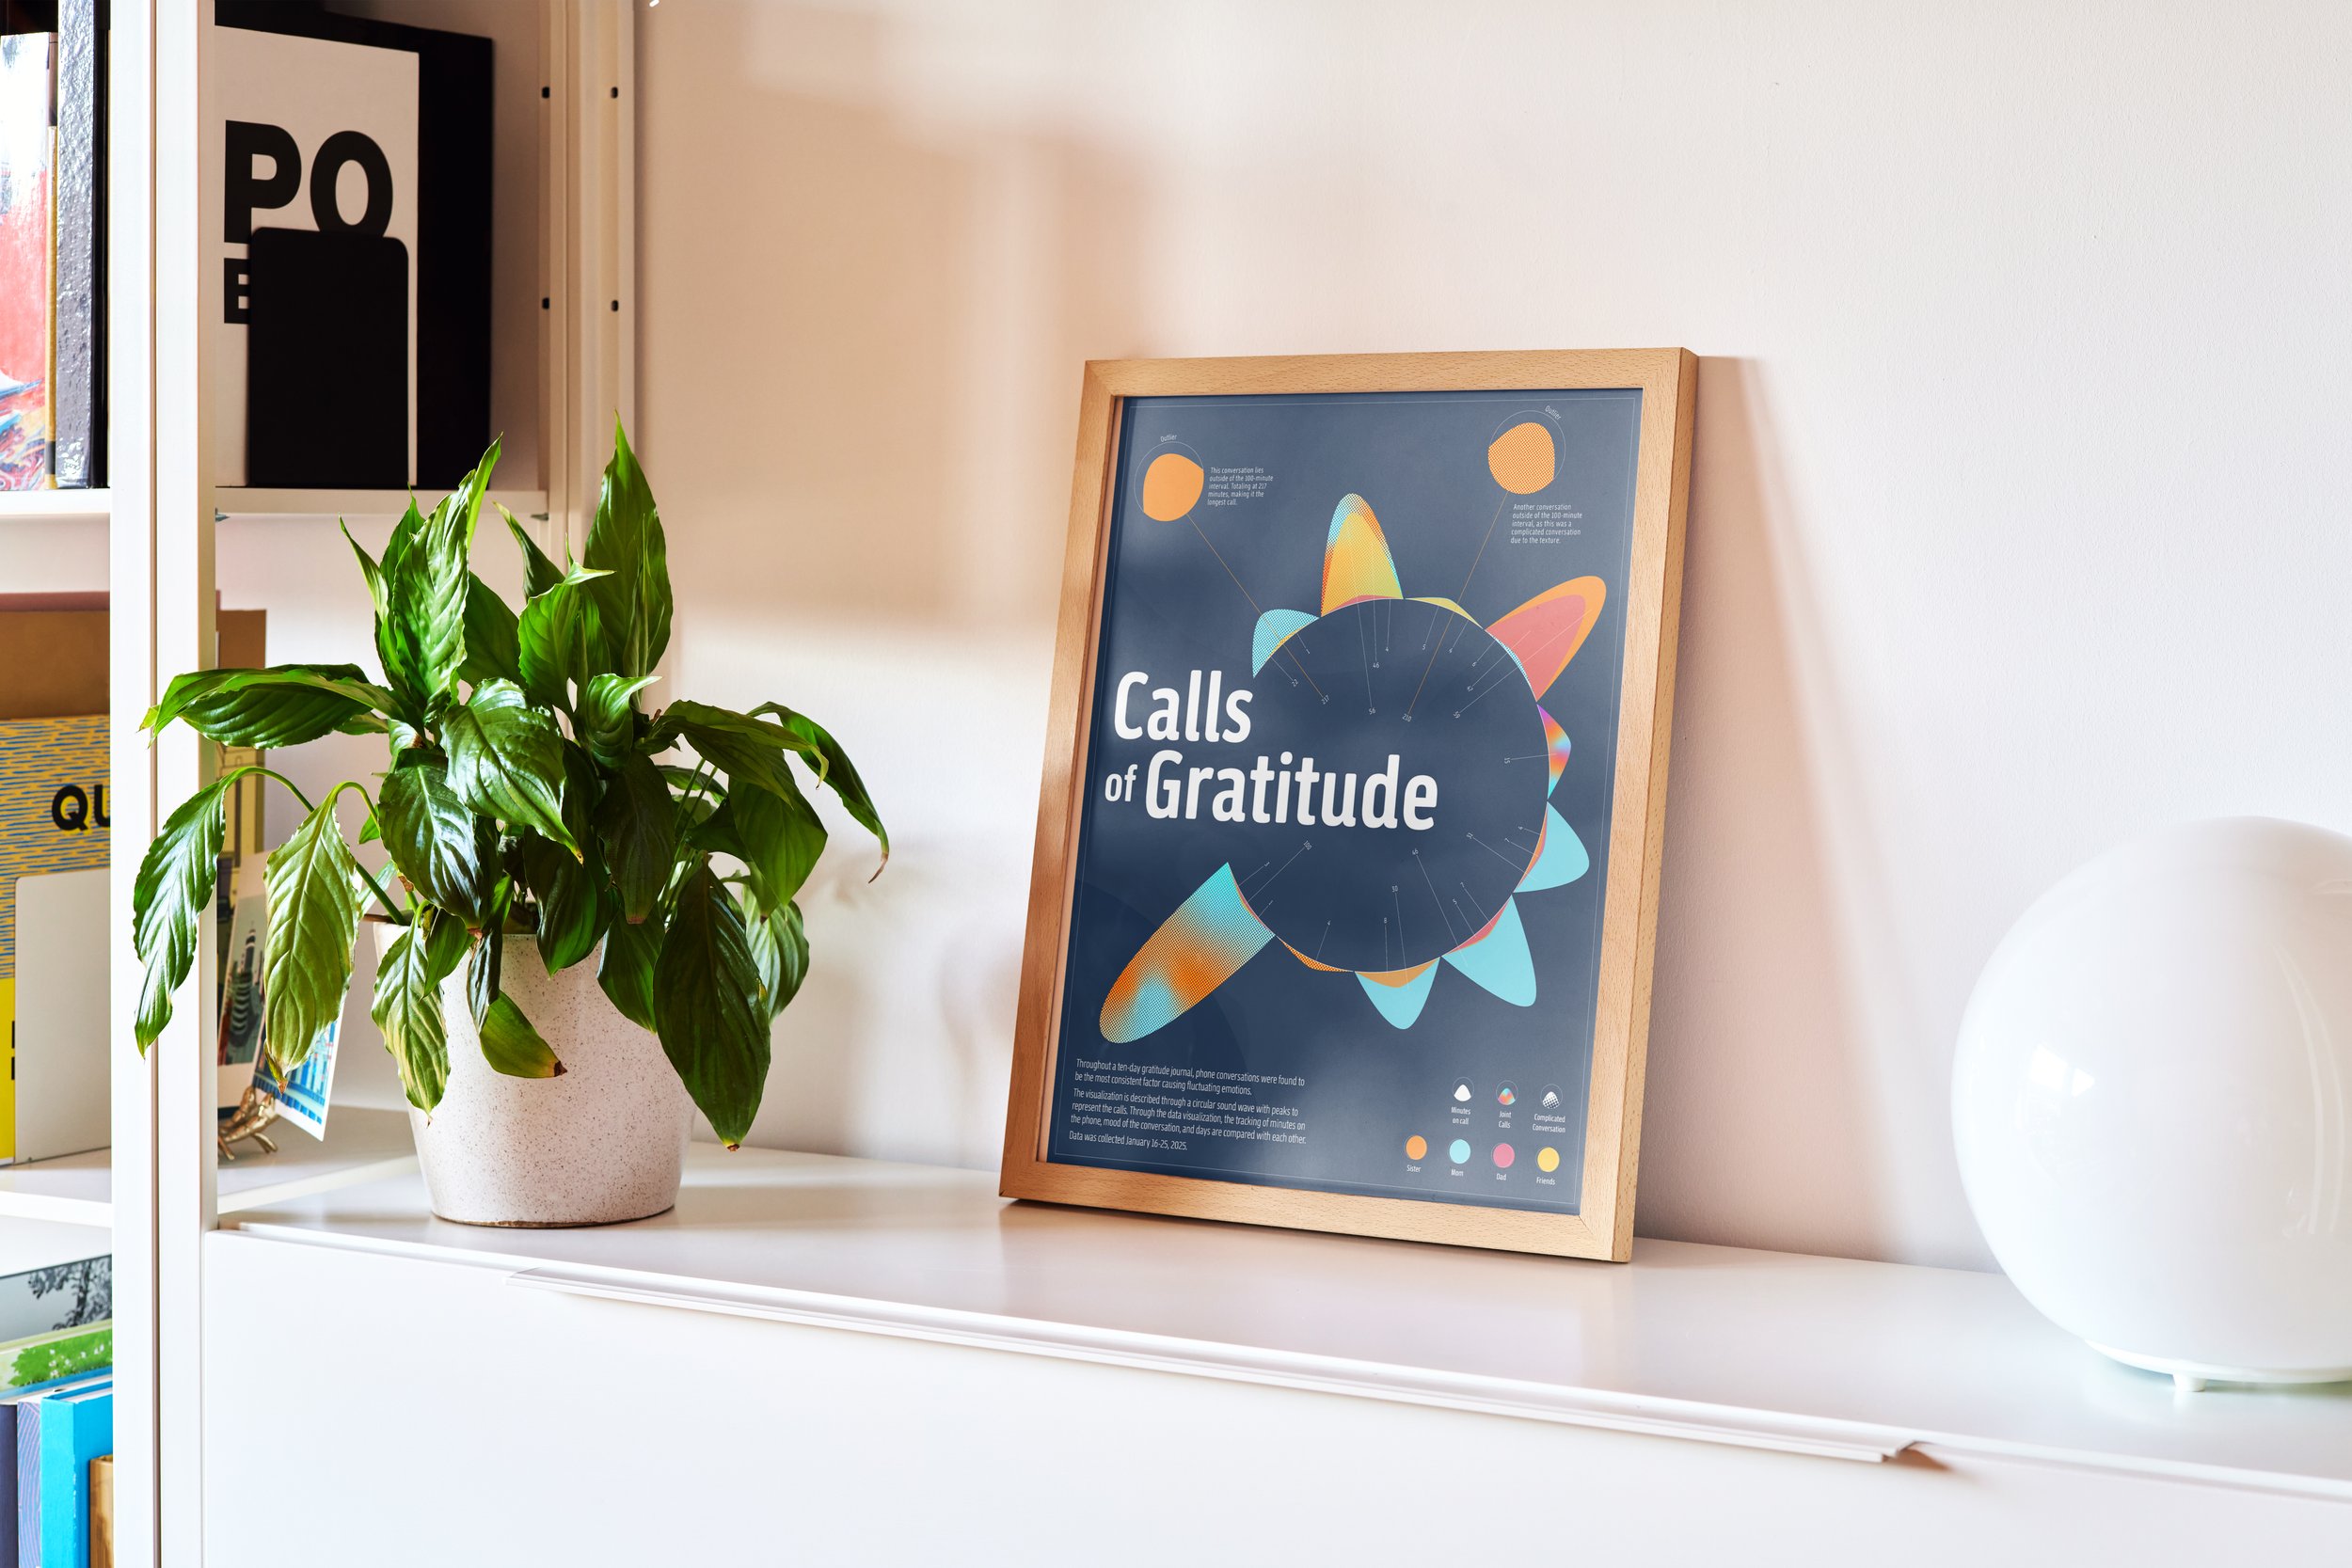
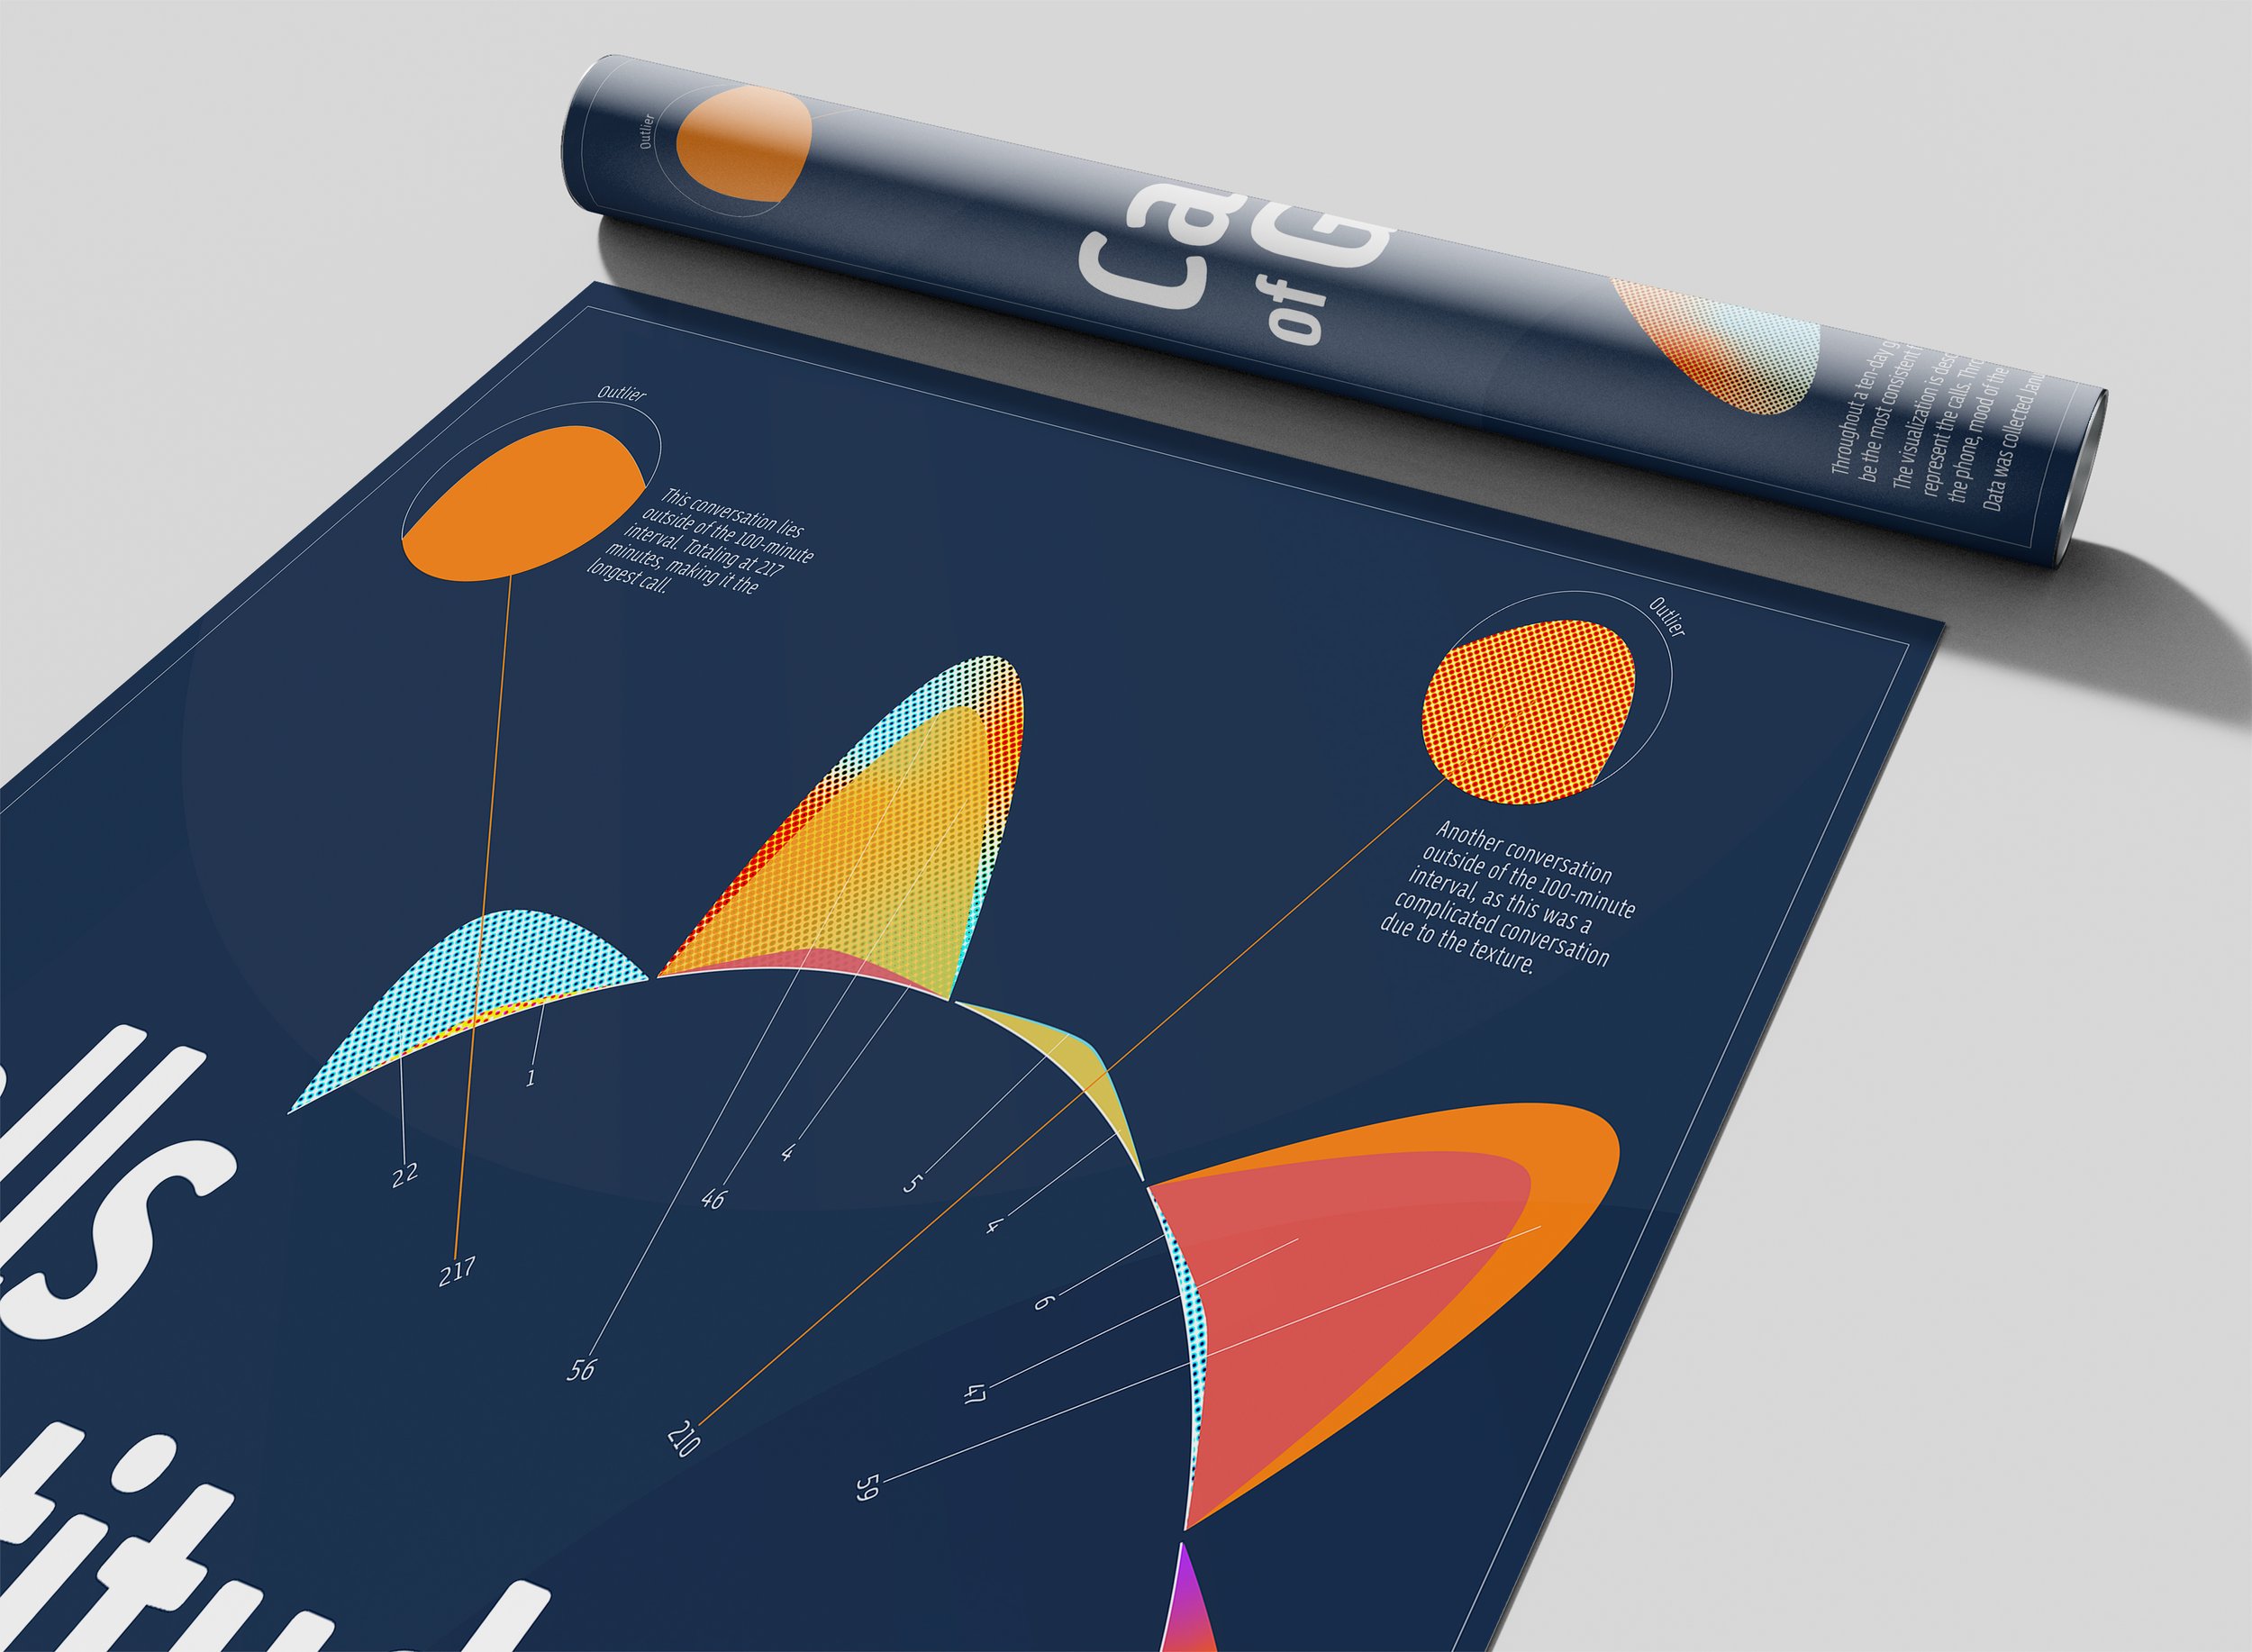
Calls of Gratitude
OSU Visual Communication | Data Visualization
Spring 2025
In my Data Visualization Class, I tracked ten days of gratitude and kindness. I then analyzed this qualitative data to identify quantitative trends and common descriptors.
The final poster.
Creative Storytelling through data. Straying away from regular bar charts, graphs, and scatterplots, I wanted to explore how to tell a story through my gratitude and kindness data. Going back to the fundamentals and focusing on design principles, textures, and shape to help execute the final outcome.
The Goal:
First I started by defining the gratitude and kindness, then tracking my data everyday through Google forms
Process:
Raw Data extracted from Excel
Then I analyzed my data and identified similarities within each day.
After I rough-sketched potential data trends from my summaries.

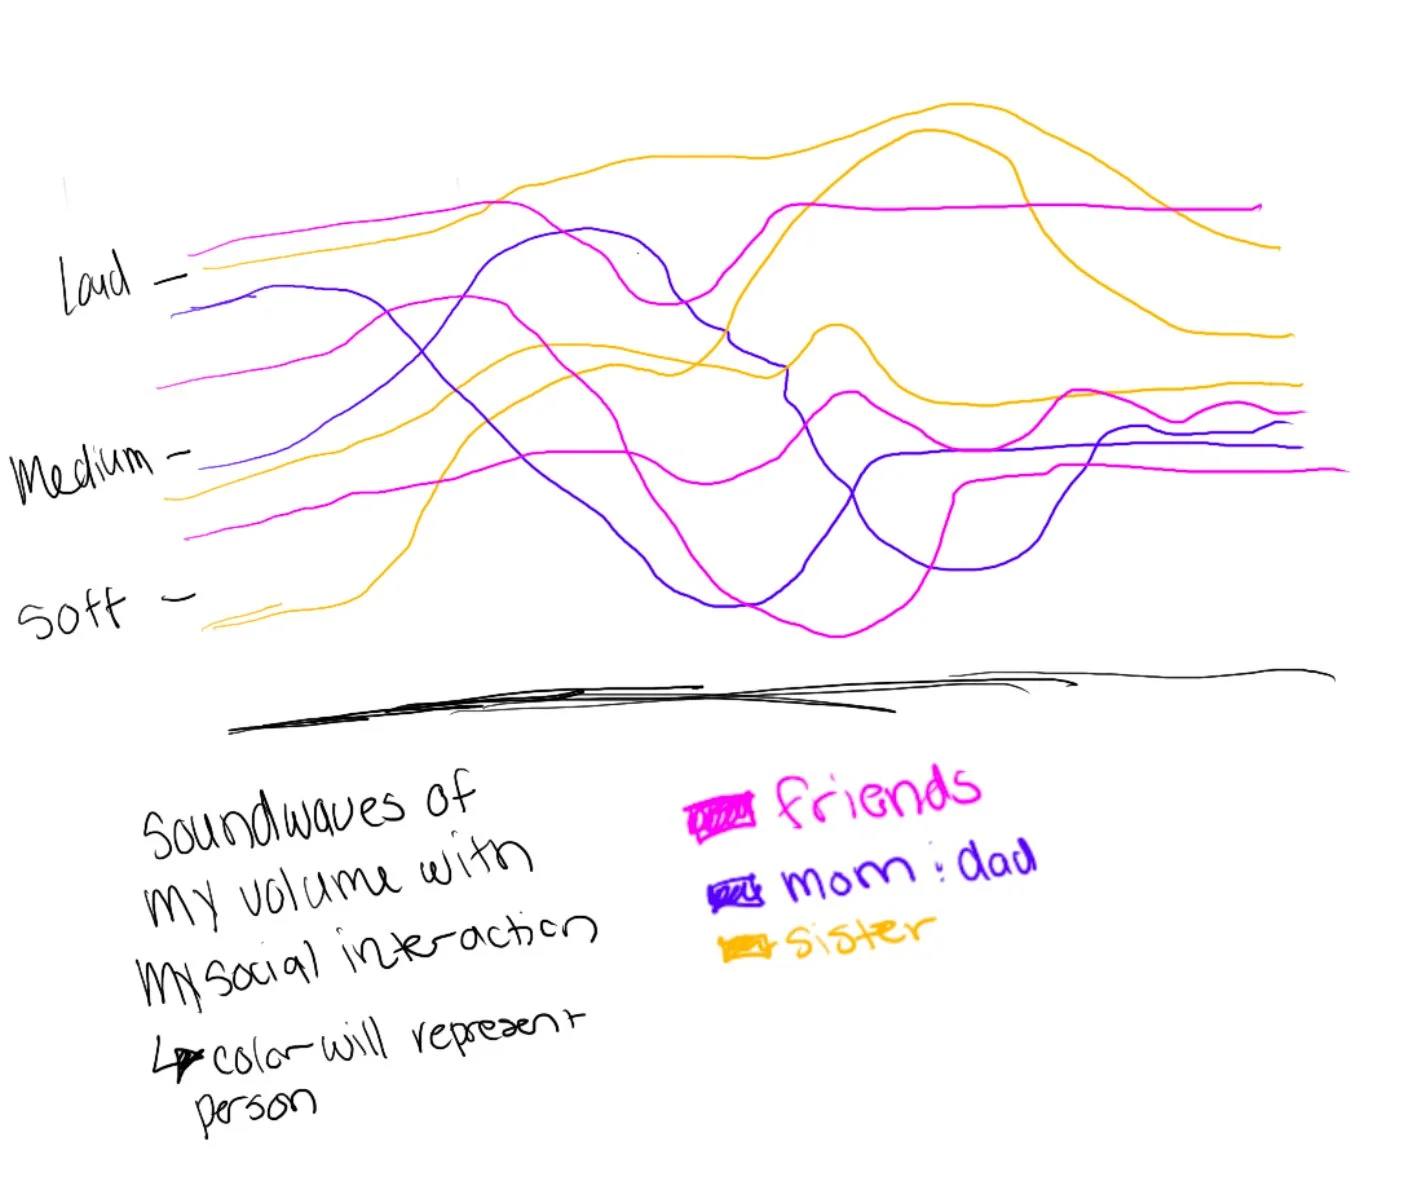
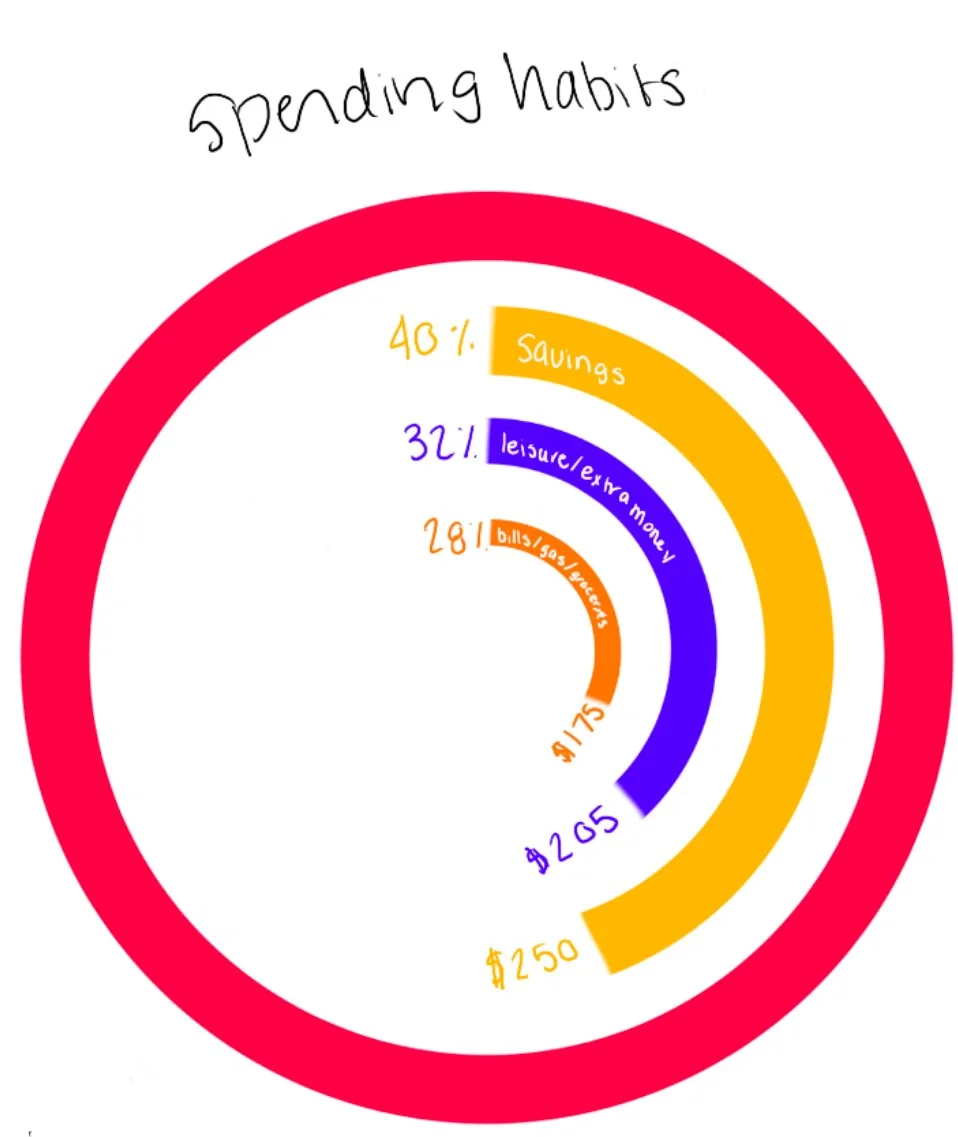
These sketches helped me narrow down my actions of calling someone were most present. This led me back to getting quantitative data from my phone logs.
Rough sketches of visualizing call logs
Production:

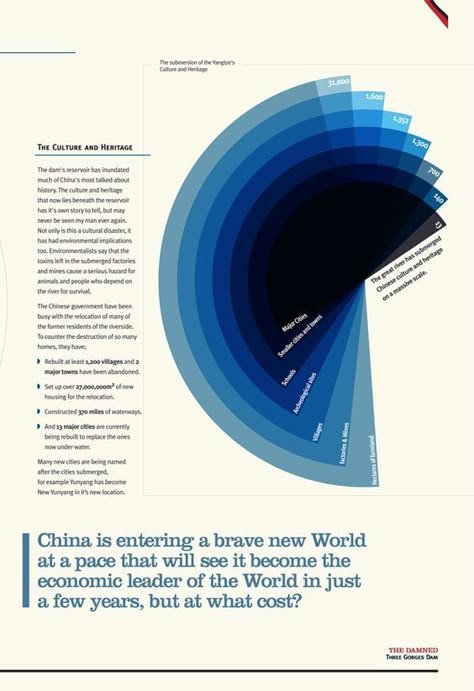

Inspirations and Abstractions that helped produce my final.
Sketches applying the circular form
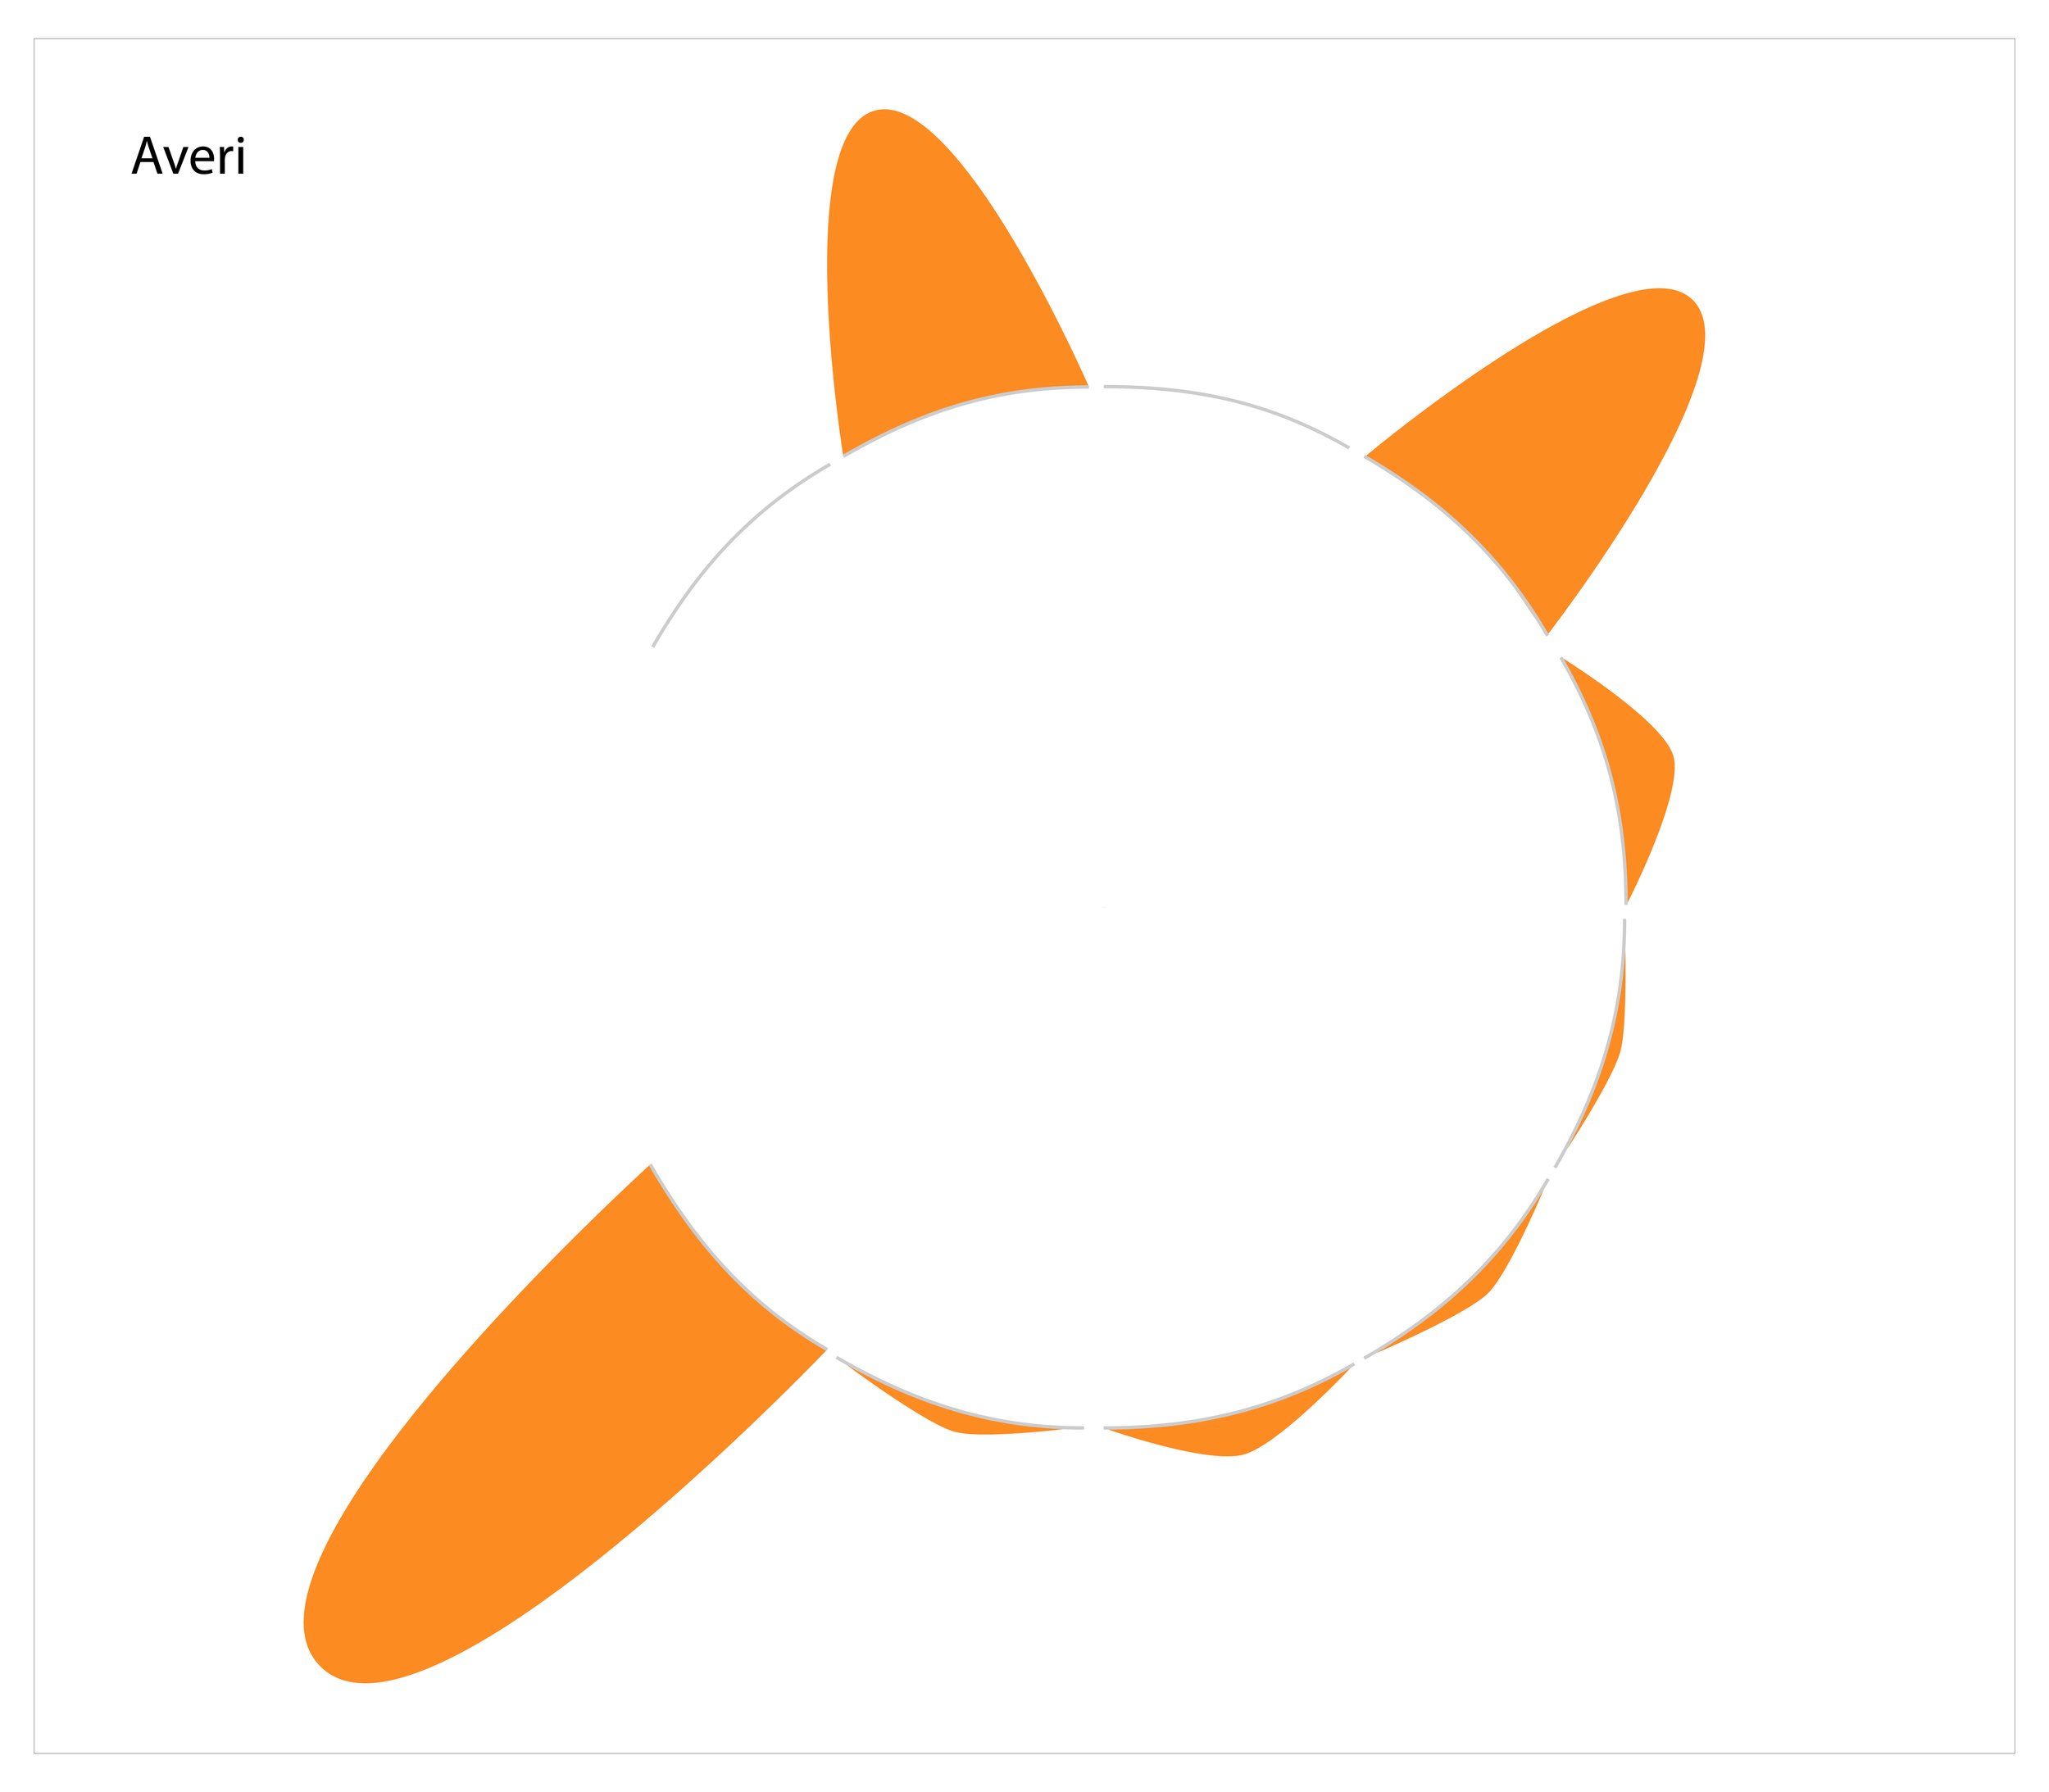
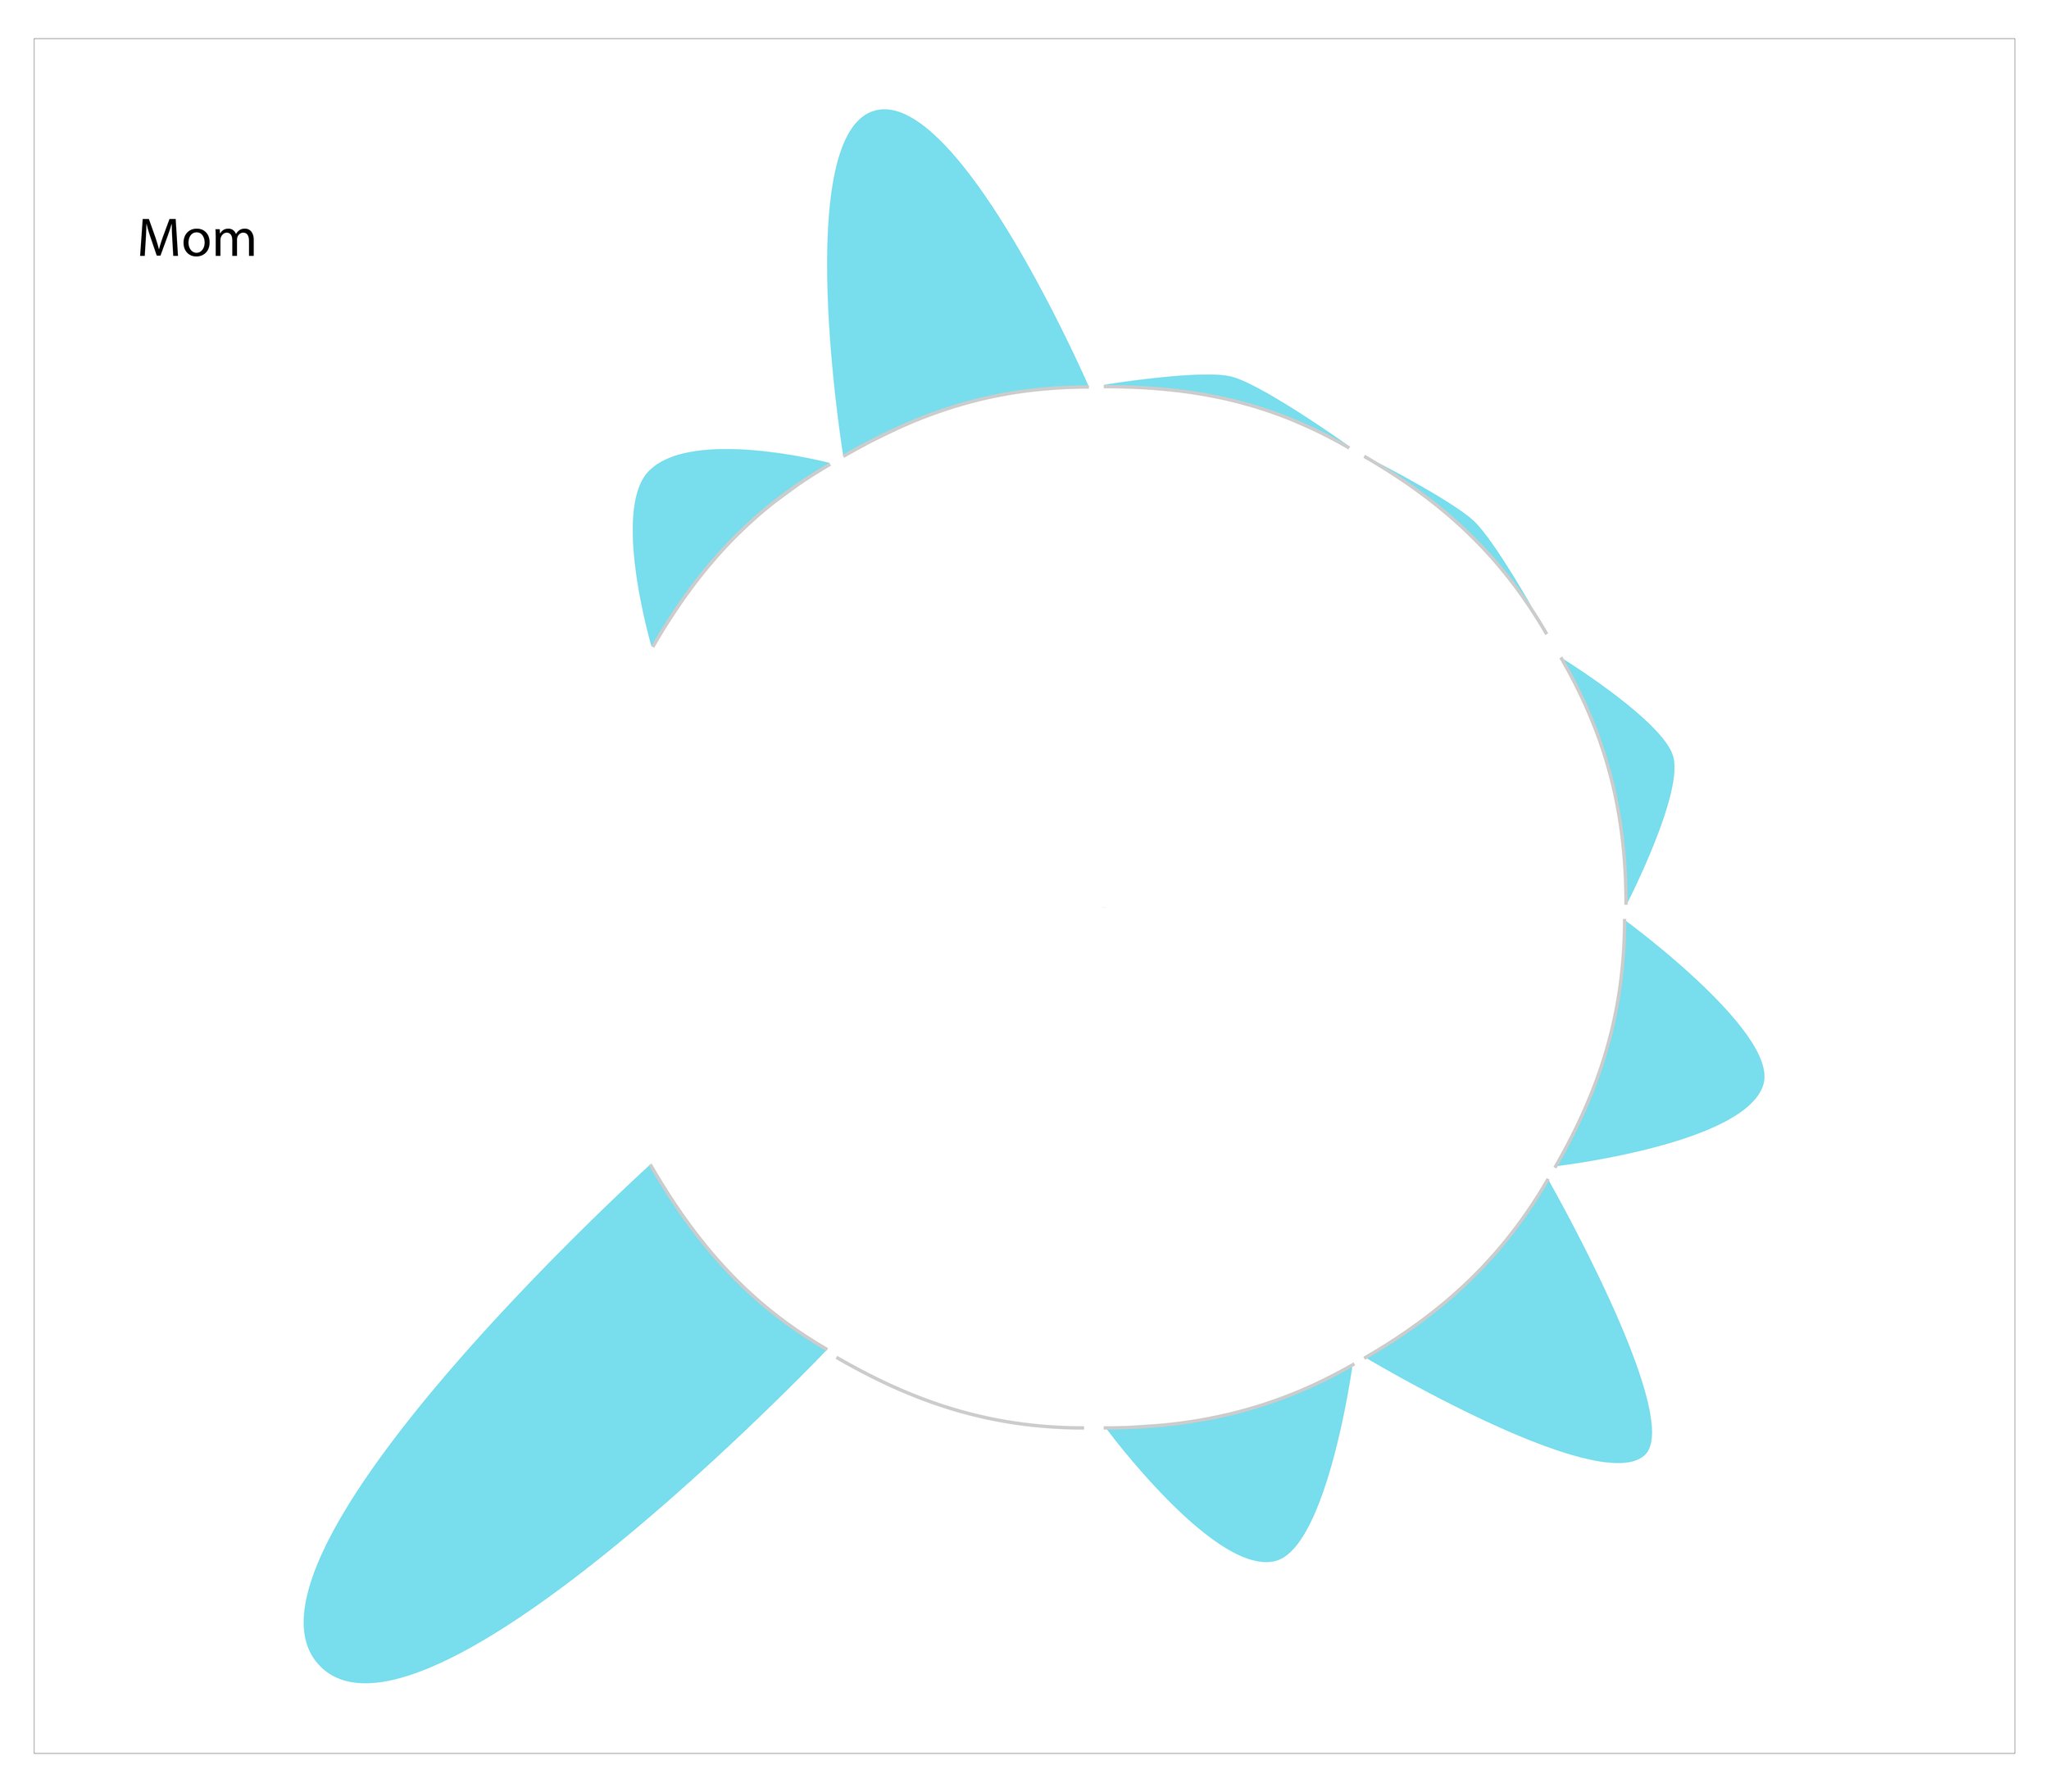
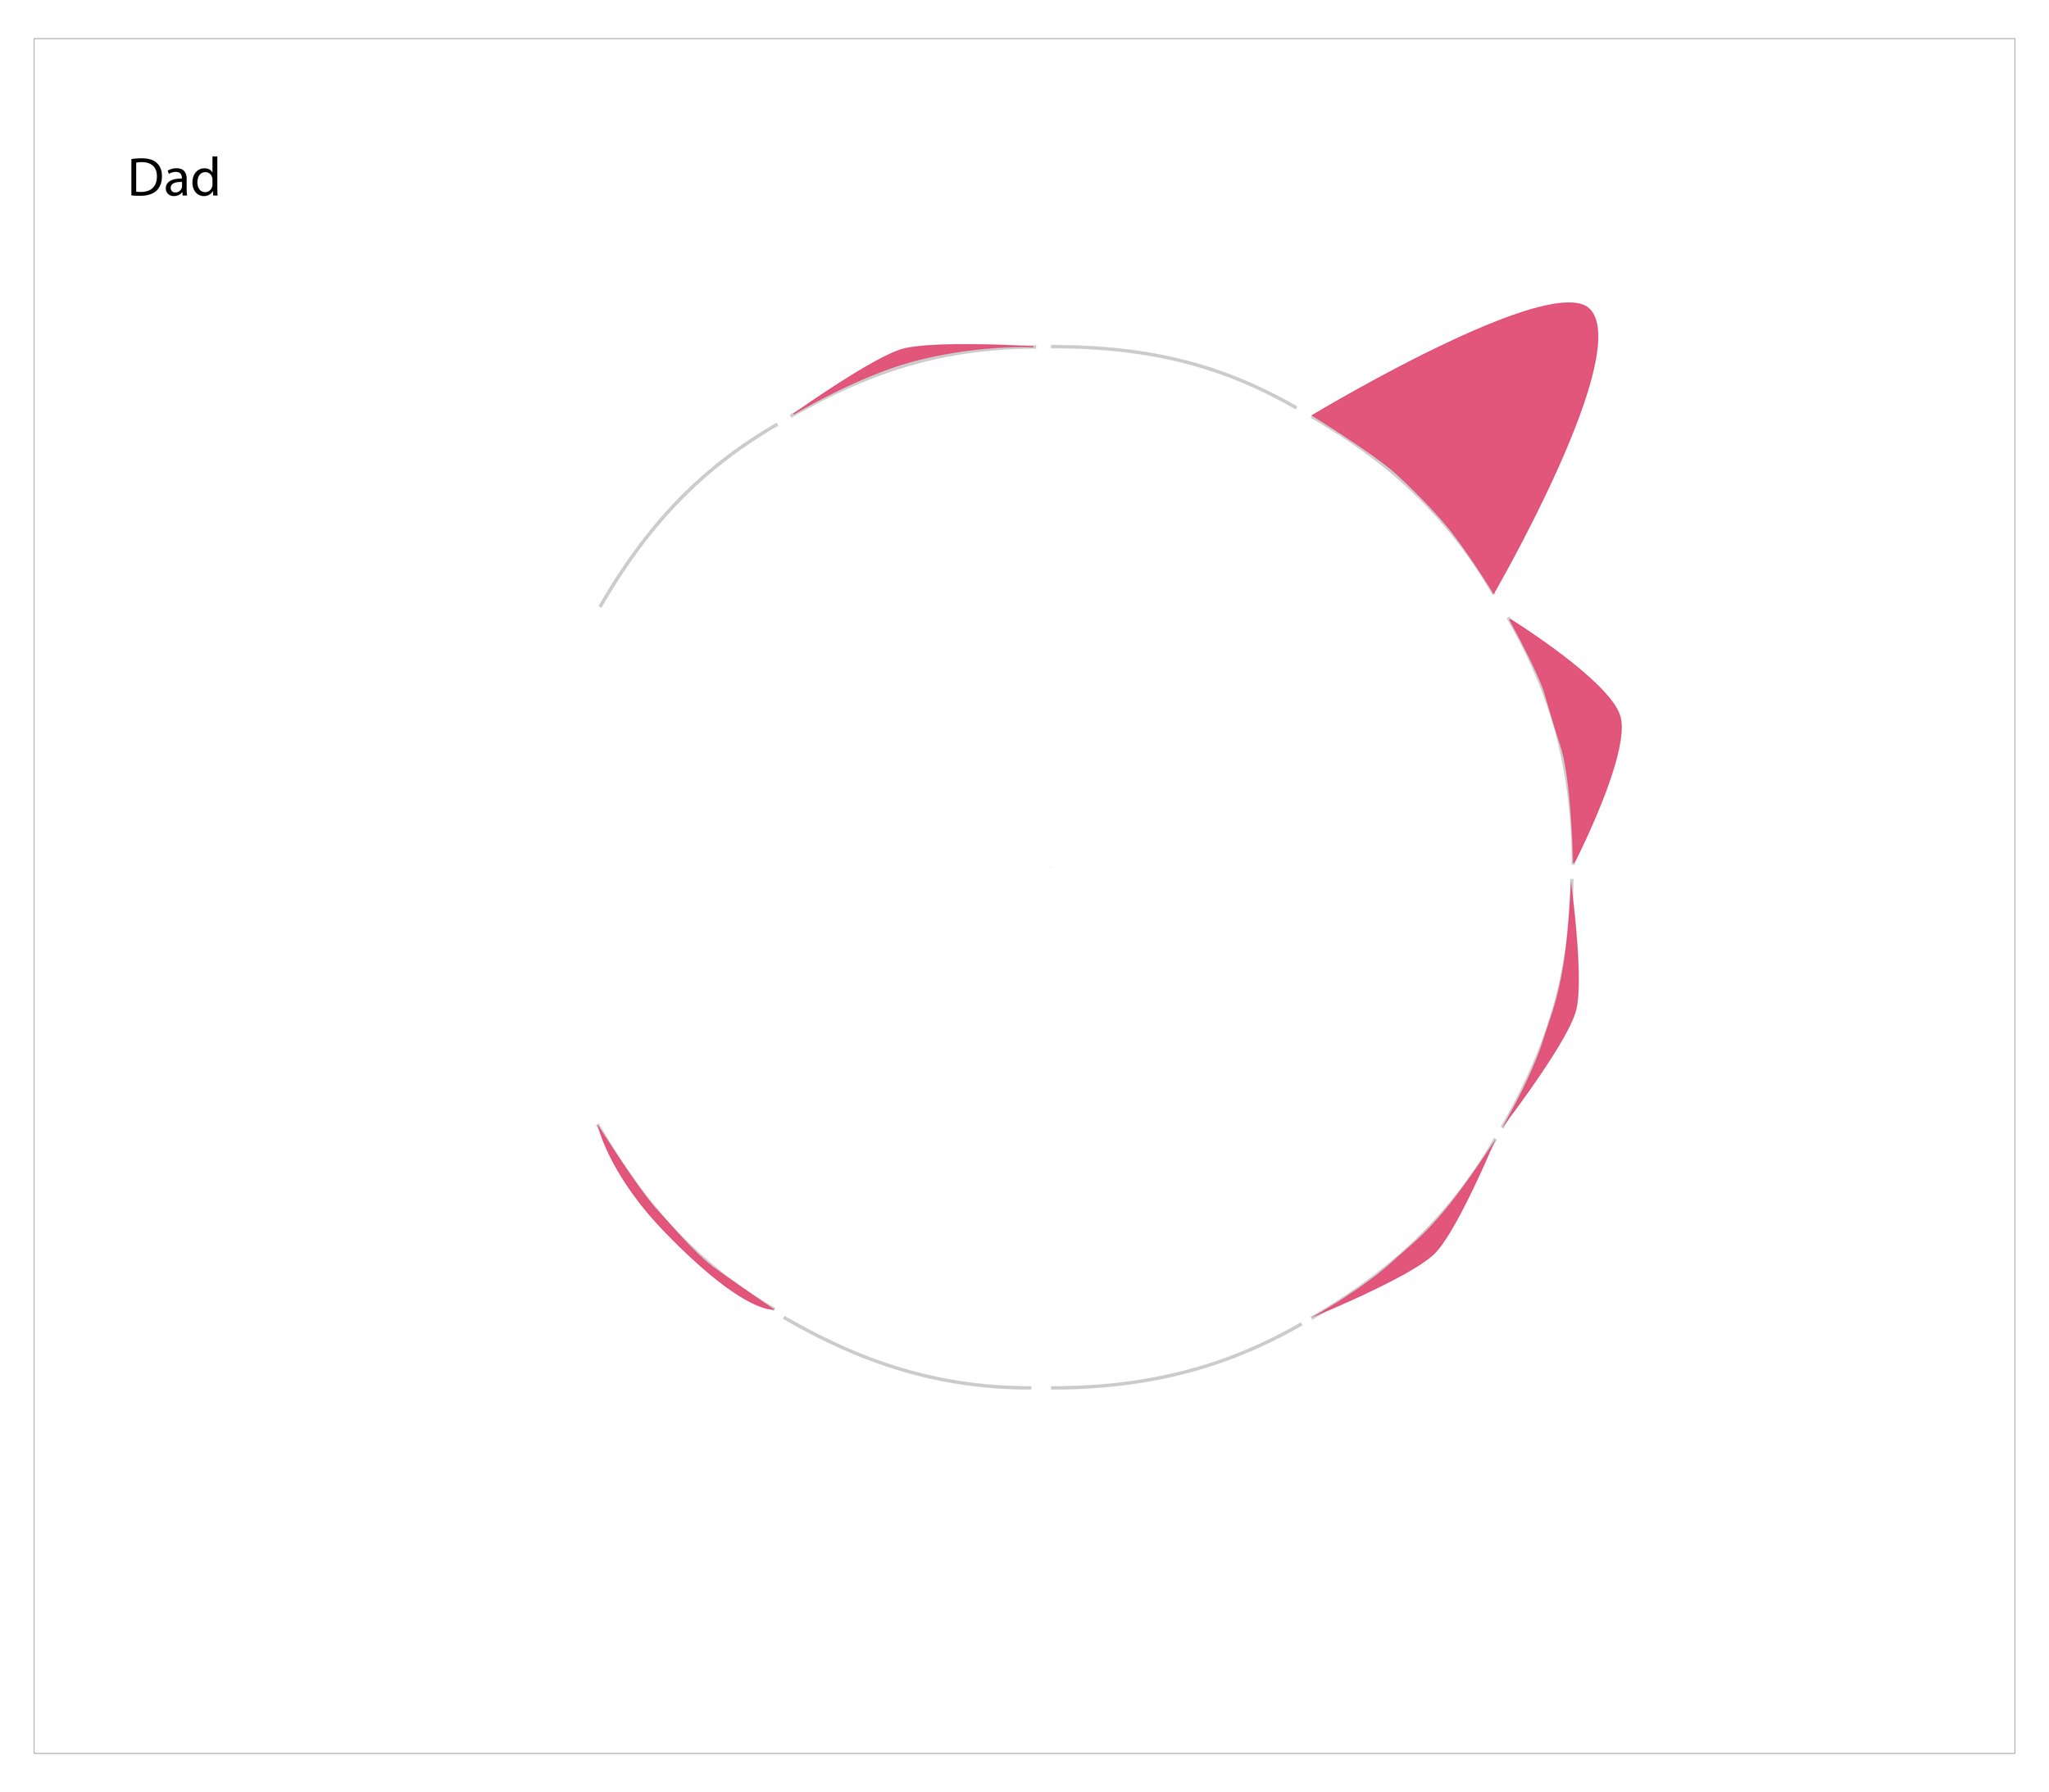
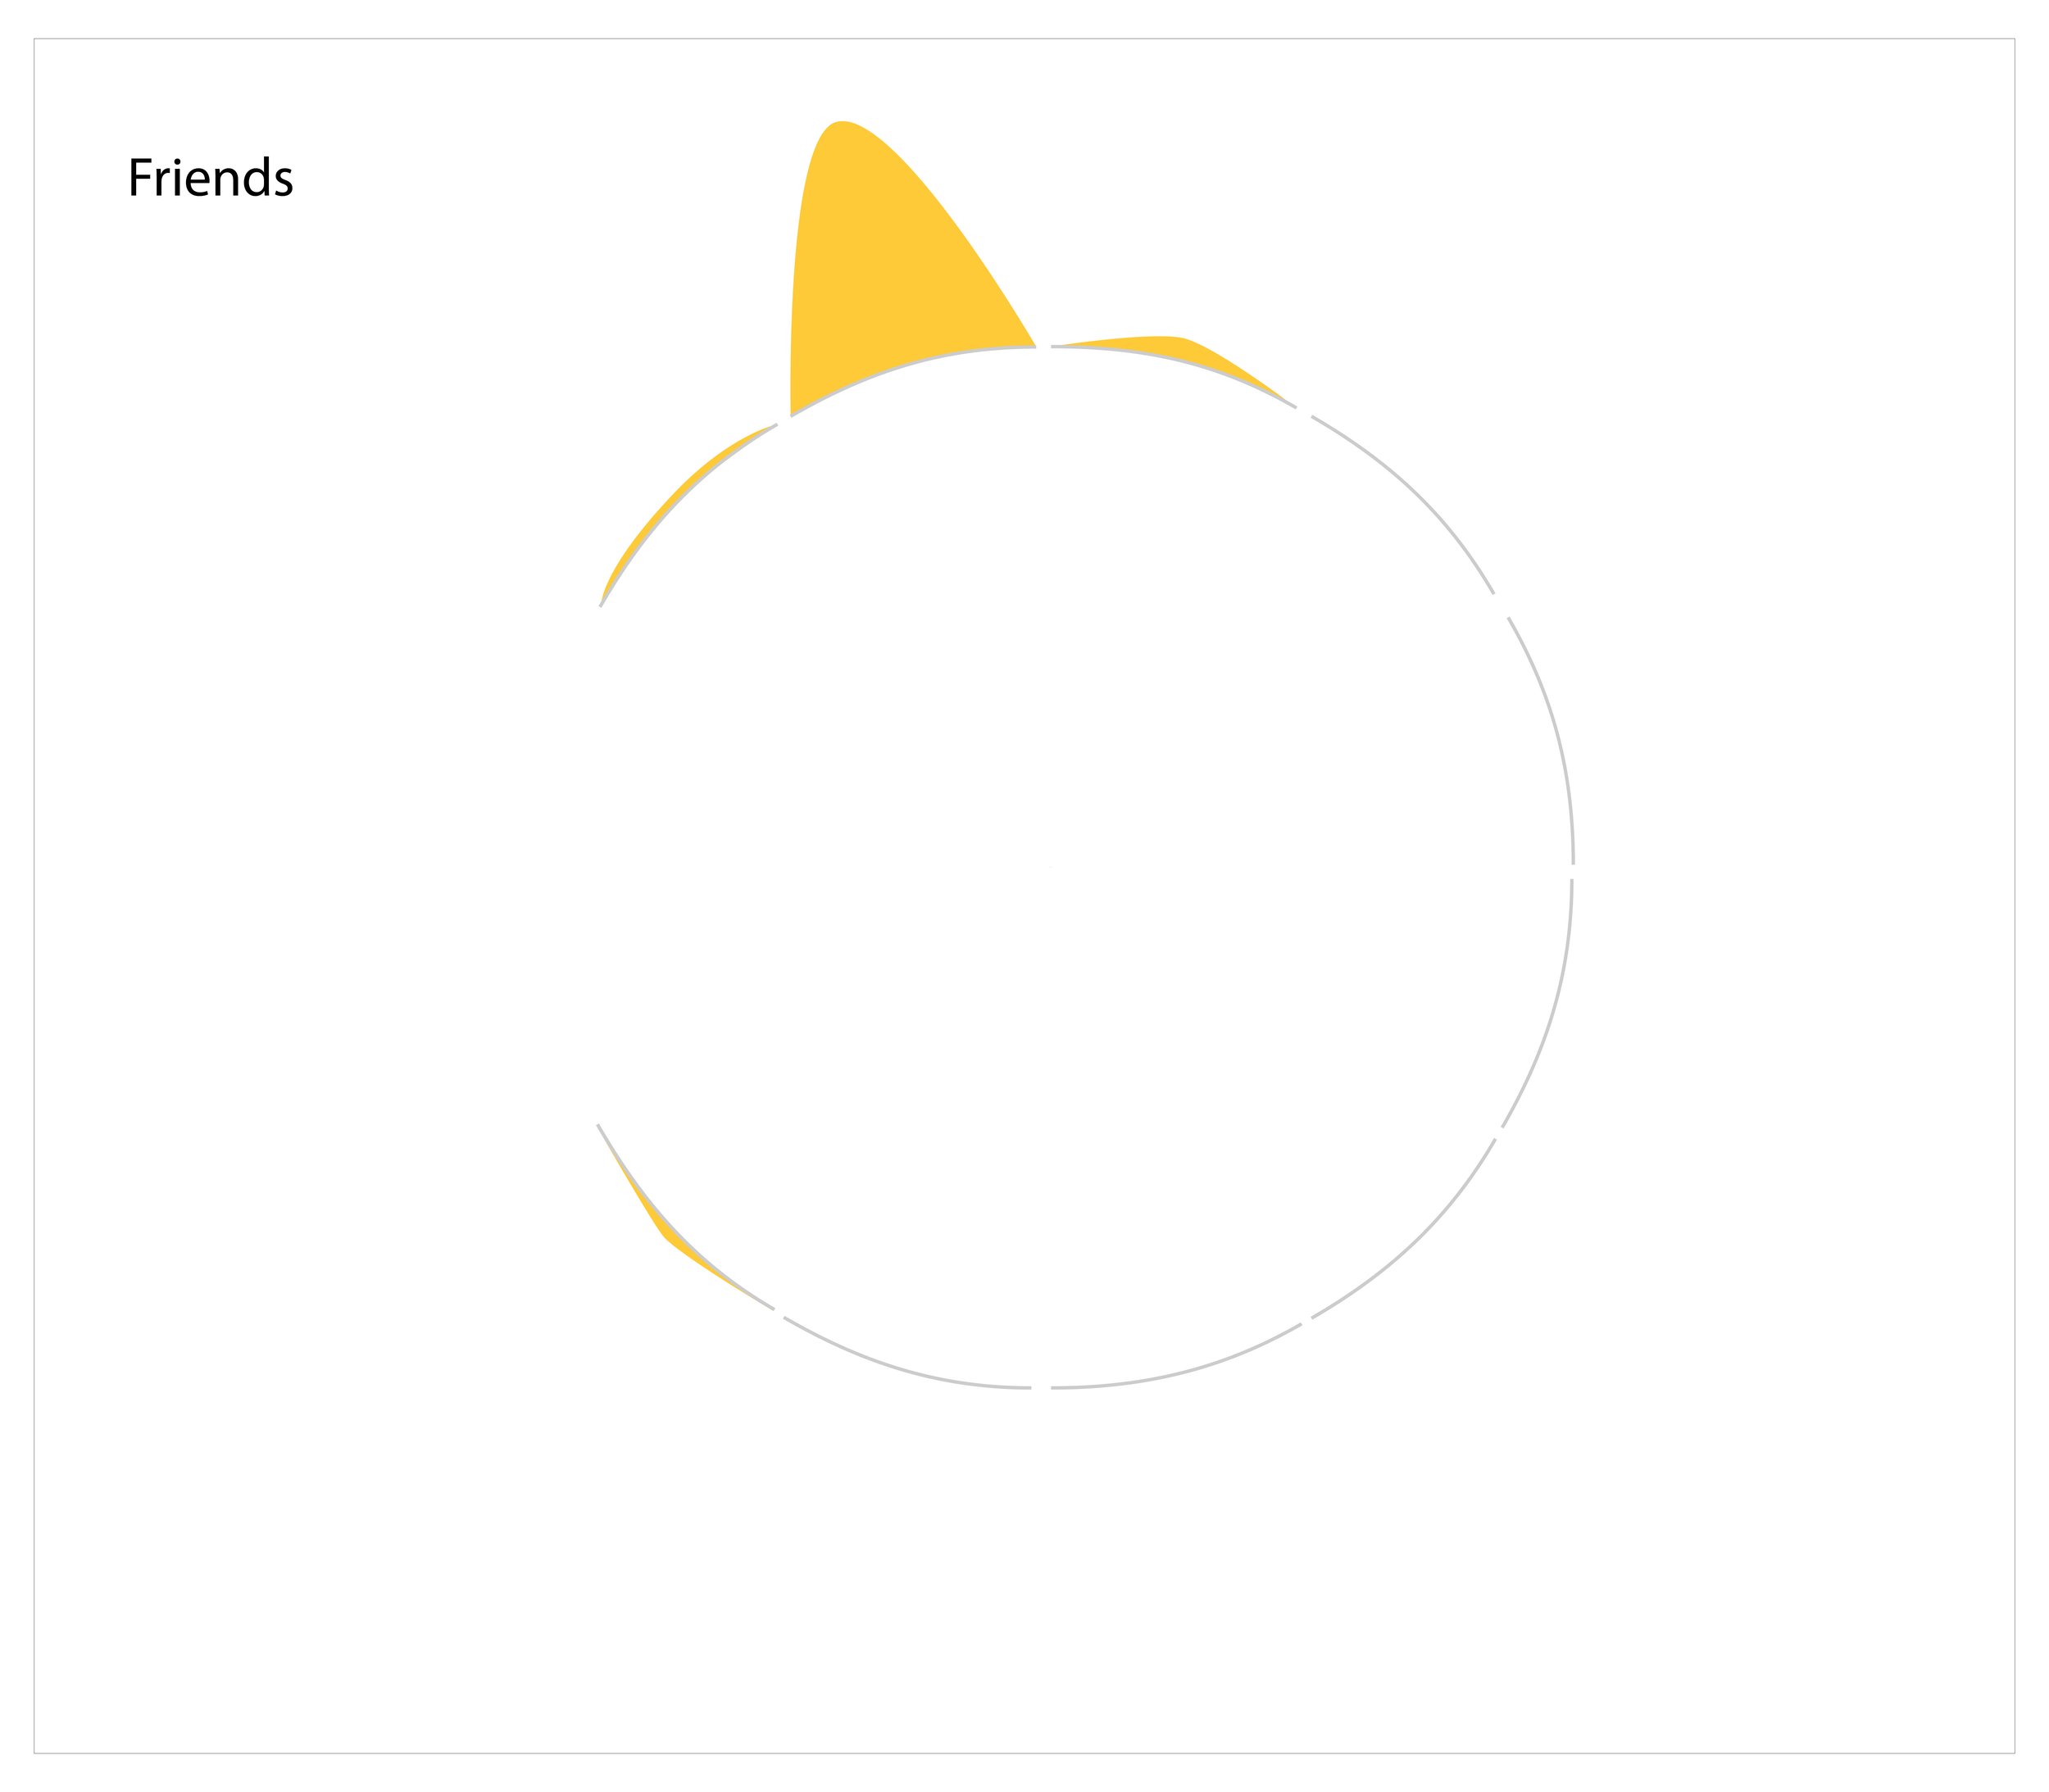
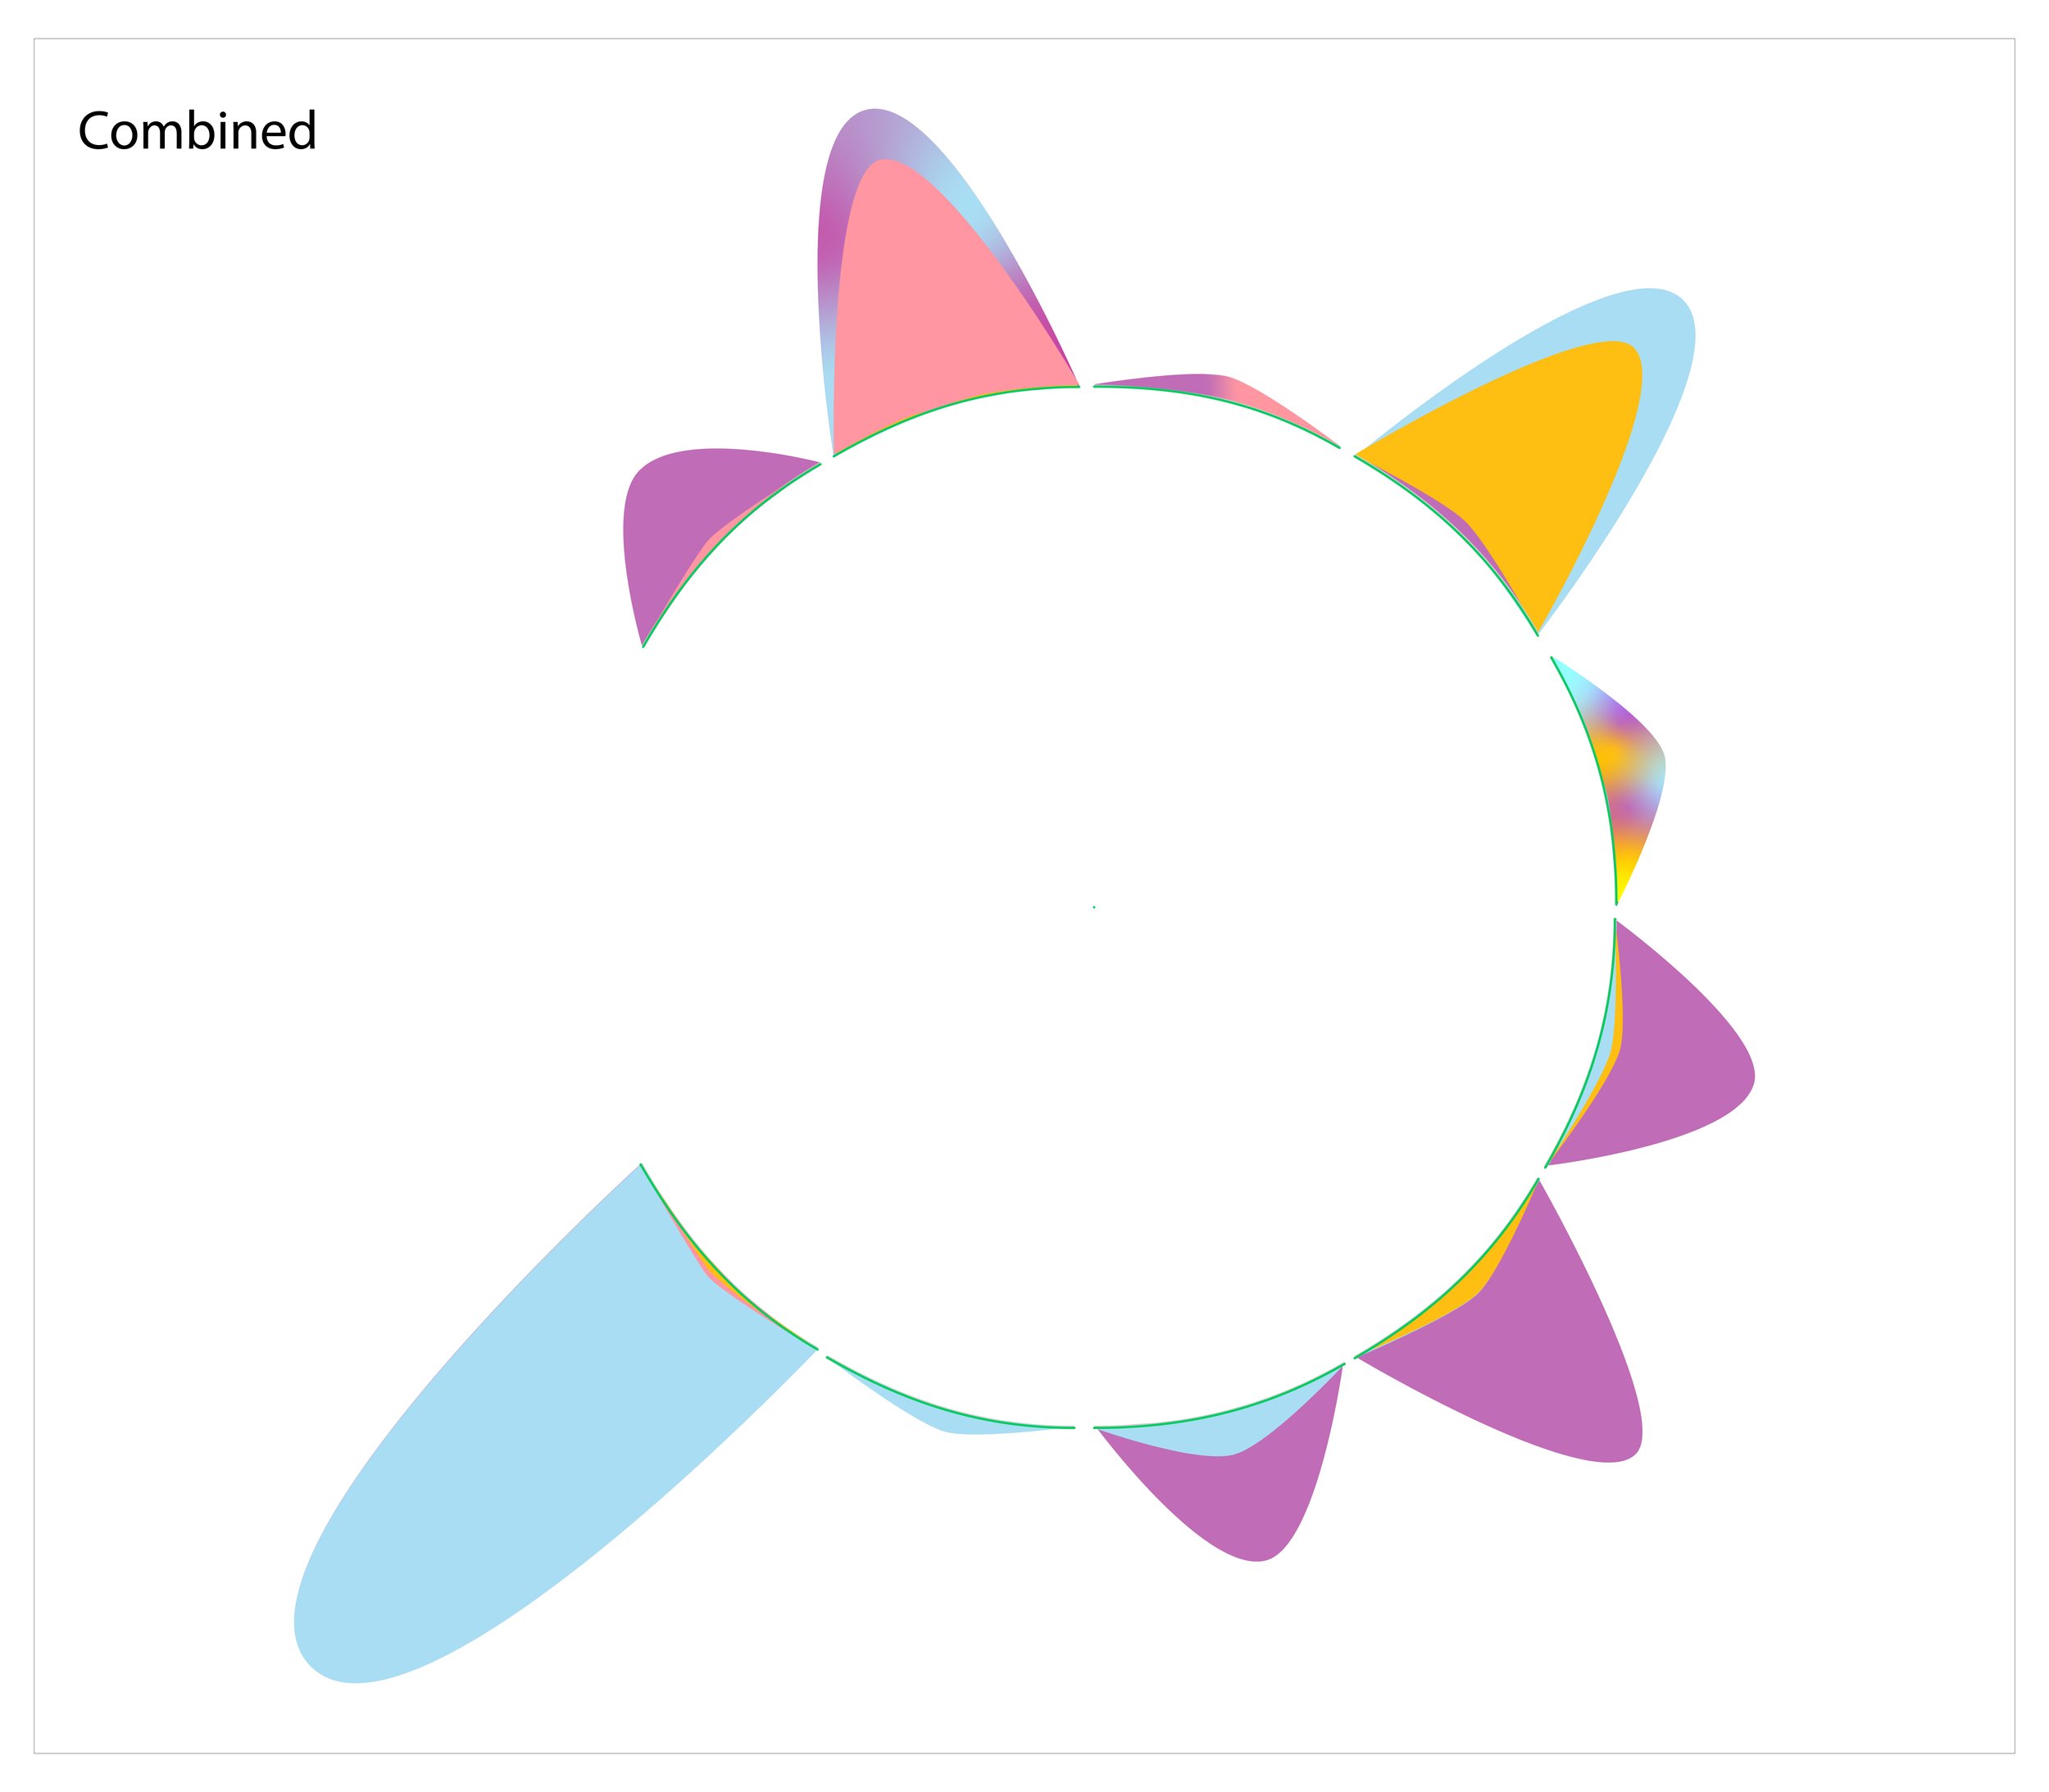


Composition Development with the addition of outliers.
